Generate 3D models and interactive charts with the Gemini app
Google has introduced a significant upgrade to the Gemini app, enabling the platform to transform user questions and complex topics into custom, interactive visualizations. While previous responses were largely limited to text and static diagrams, the app now provides functional simulations that allow users to explore concepts in greater depth directly within their chat window.
From static images to functional simulations
The new capability moves beyond simple illustrations, offering users the ability to engage with dynamic models. Whether a user is rotating a complex molecule or simulating a physics system, these functional tools provide a more immersive way to understand challenging subject matter. By moving away from fixed diagrams, Gemini now allows for a more hands-on approach to learning and exploration.
For example, when investigating the mechanics of the moon orbiting the Earth, users are no longer confined to a static representation. The interactive interface allows individuals to manually adjust sliders or input specific numerical values for variables such as gravity strength and initial velocity. These adjustments provide an instant look at how different factors contribute to a stable orbit, allowing users to see the results of their changes in real time.
How to access the new features
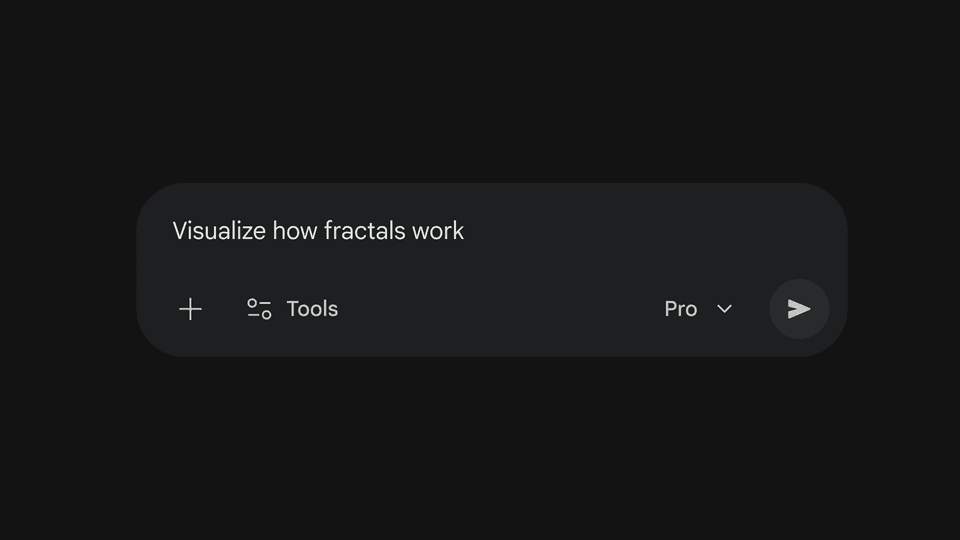
This feature is currently rolling out globally to all Gemini app users. To begin using these interactive tools, users should navigate to gemini.google.com and select the Pro model from the prompt bar. By asking Gemini to "show me" or "help me visualize" a complex concept, the app will generate the appropriate interactive model or chart.
It is important to note that this functionality is not yet available for Education and Workspace accounts. As the rollout continues, users across the globe will be able to leverage these simulations to better grasp intricate topics through direct interaction.
Comments (0)
to join the discussion
No comments yet
Be the first to share your thoughts!