The Google ADK Multi-Agent Pipeline tutorial, published on April 13, 2026, by Asif Razzaq, outlines a comprehensive framework for building advanced data analysis systems using agentic AI. The tutorial demonstrates how to organize a multi-agent system that coordinates specialized tools to perform end-to-end analytical tasks, including data loading, statistical testing, visualization, and report generation. By leveraging the Google ADK and a master analyst agent, the system provides a structured and scalable approach to production-style data workflows.
Infrastructure and Data Management
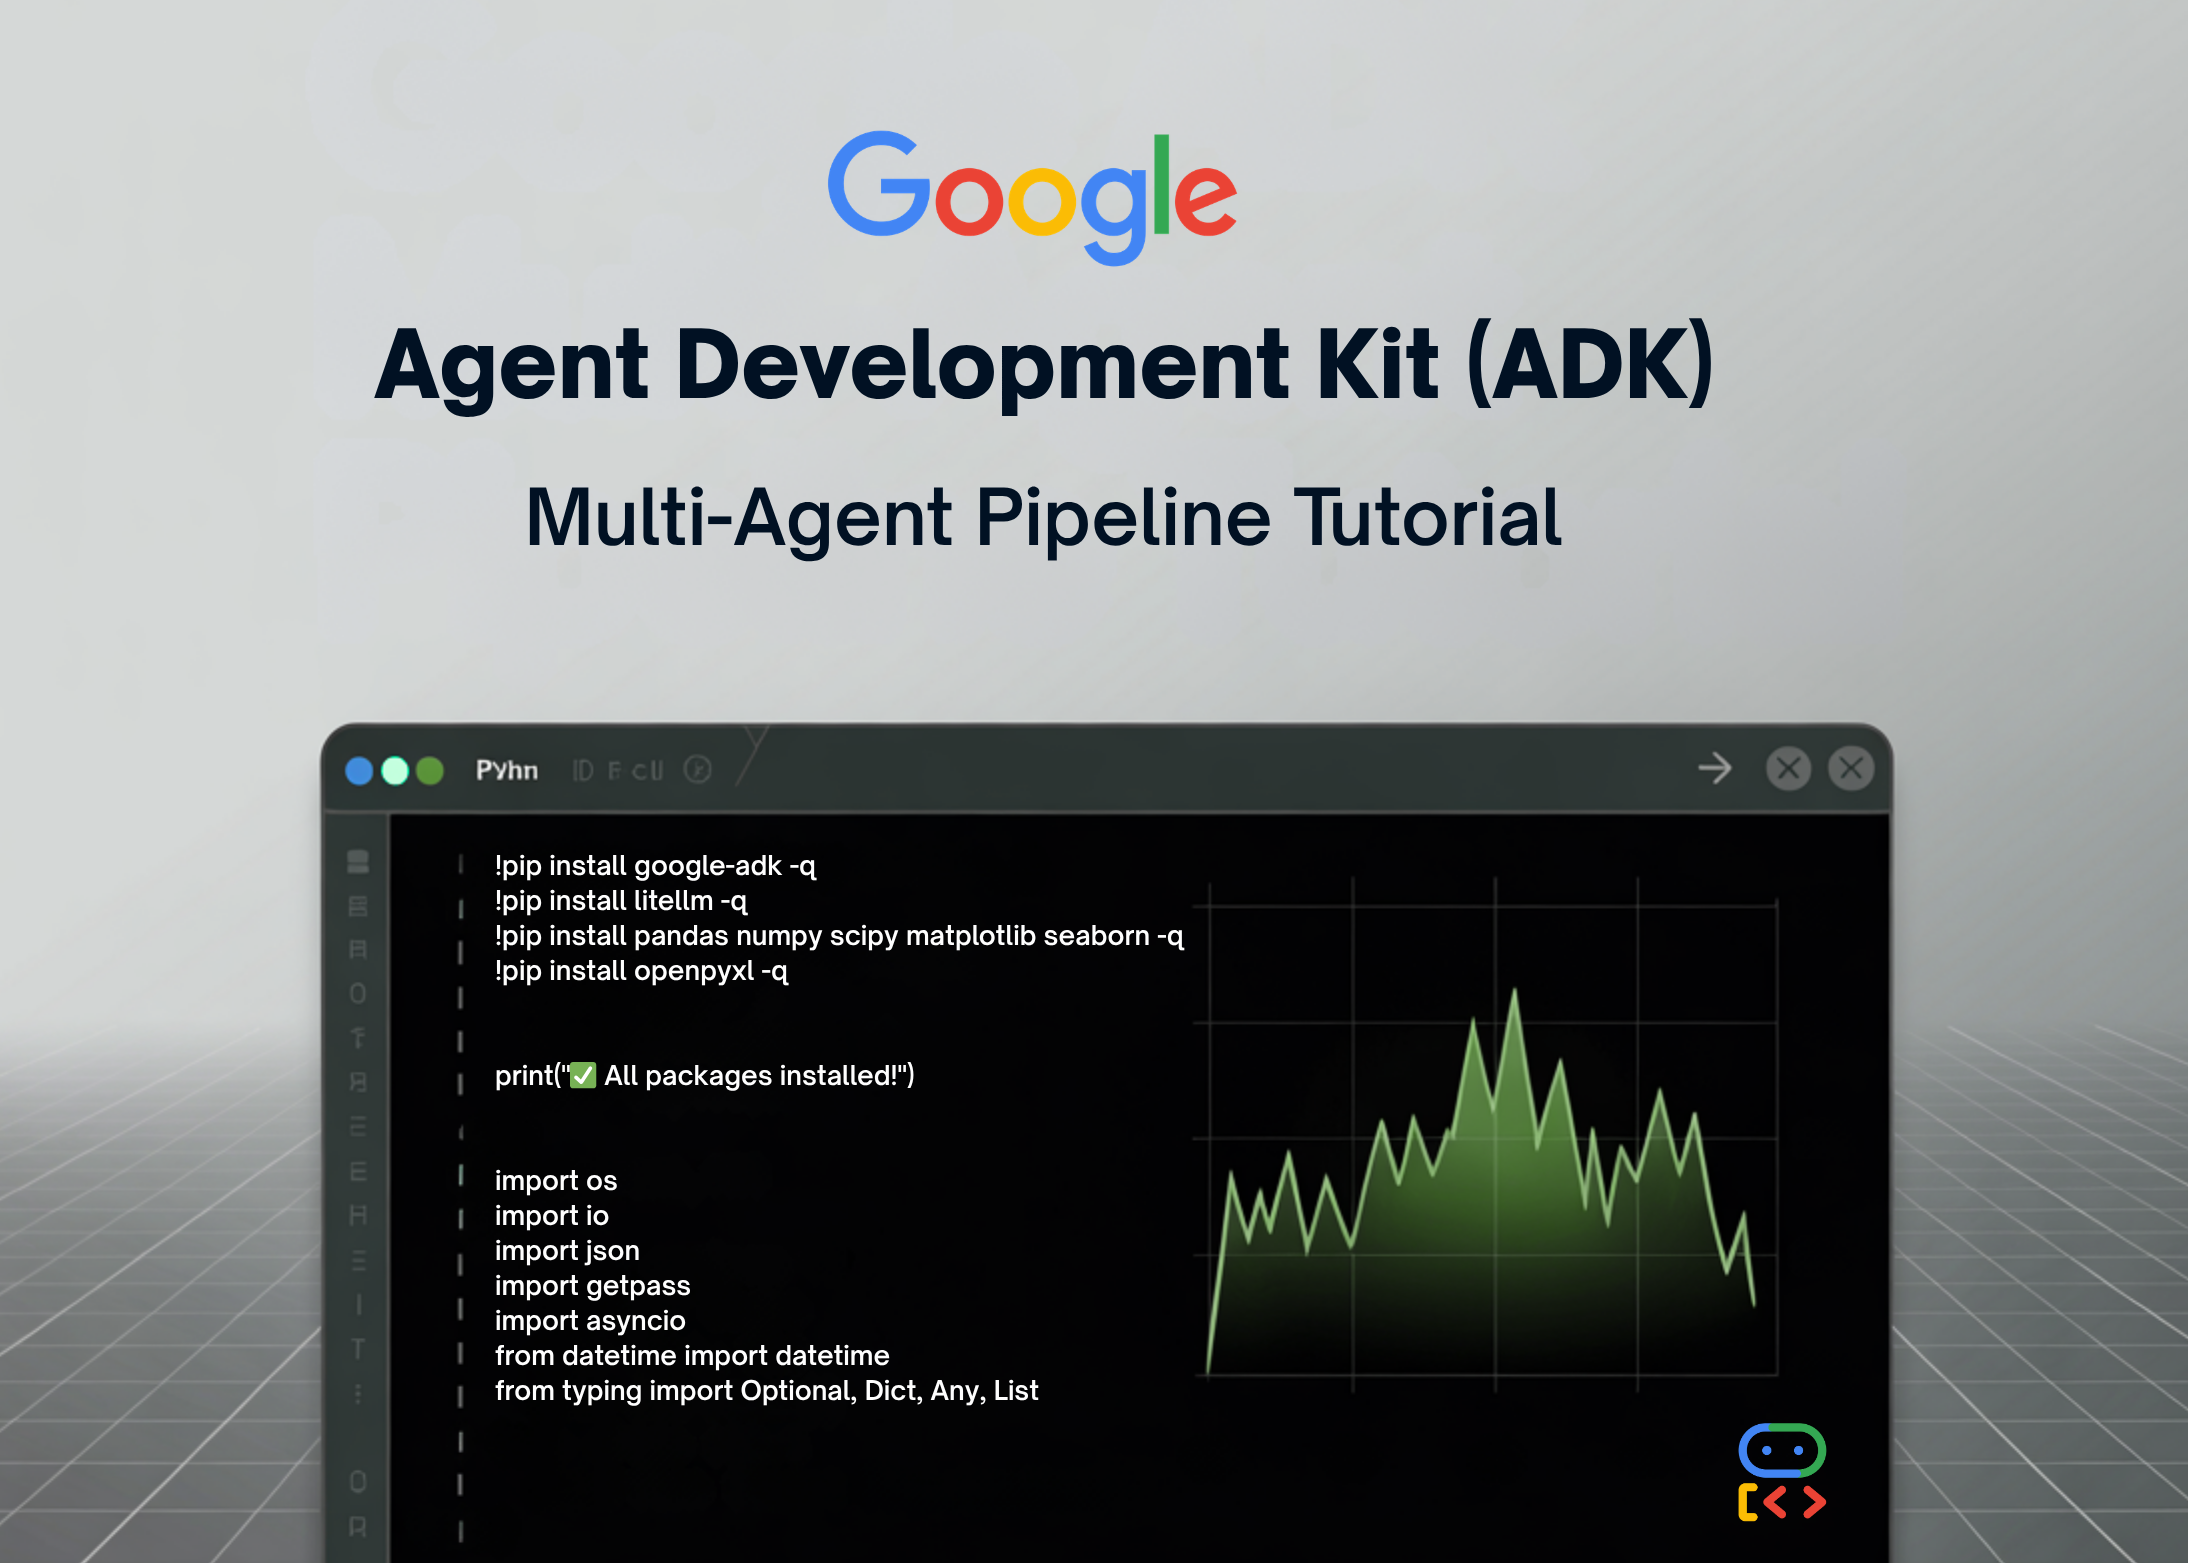
The foundation of the pipeline involves setting up a secure environment that integrates essential libraries such as pandas, scipy, and matplotlib alongside the Google ADK. A centralized DataStore is implemented as a singleton to manage datasets, track analysis history, and ensure data consistency across the multi-agent system. This architecture allows for the seamless handling of various data sources, including CSV files and synthetic datasets generated for sales, customer demographics, time series, and survey analysis.
To maintain system integrity, the tutorial introduces a serialization helper designed to convert complex data types into JSON-safe formats. This ensures that outputs remain clean and compatible with agentic communication throughout the workflow. By defining specialized tools for loading and listing datasets, the system ensures that the master analyst agent has immediate access to structured information required for subsequent processing.
Analytical Capabilities and Visualization
The pipeline incorporates a robust statistical analysis layer that enables agents to perform deep dives into tabular data. Available functions include descriptive statistics, correlation analysis, and various hypothesis tests such as Shapiro-Wilk for normality, independent samples t-tests, ANOVA, and chi-square tests. Additionally, the system features outlier detection methods using interquartile range (IQR) and Z-score calculations, allowing agents to identify and interpret anomalies within the data.
Beyond statistical computation, the framework includes a visualization engine capable of generating histograms, scatter plots, bar charts, line graphs, box plots, heatmaps, and pie charts. These tools are designed to work in tandem with the analytical agents, enabling the automated creation of visual reports and distribution analyses. By connecting these capabilities through a master analyst agent, the tutorial illustrates how a coordinated system can effectively transform raw data into actionable insights in a production-ready environment.
Comments (0)
to join the discussion
No comments yet
Be the first to share your thoughts!