
Alemia
Alemia is an AI-powered data analytics platform for turning uploaded or connected data into natural-language answers, visualizations, reports, and recommendations. It is designed to reduce the manual work involved in exploring business data and presenting findings.
What it does
Alemia lets users upload spreadsheets or connect data sources, then ask questions in plain English. According to the vendor, the platform can process CSV, Excel, JSON, PostgreSQL, and other database data. Its AI analyzes the information, identifies patterns, and returns charts and insights intended to support faster decisions.
The platform also includes tools for interactive data visualization, forecasting and prediction, and PDF report creation. Users can export charts as images, download reports as PDFs, or embed visualizations for sharing. Alemia offers a free plan with no credit card required, while plan details are provided on its pricing page.
Notable capabilities
- Natural-language questions for exploring uploaded or connected data without writing code.
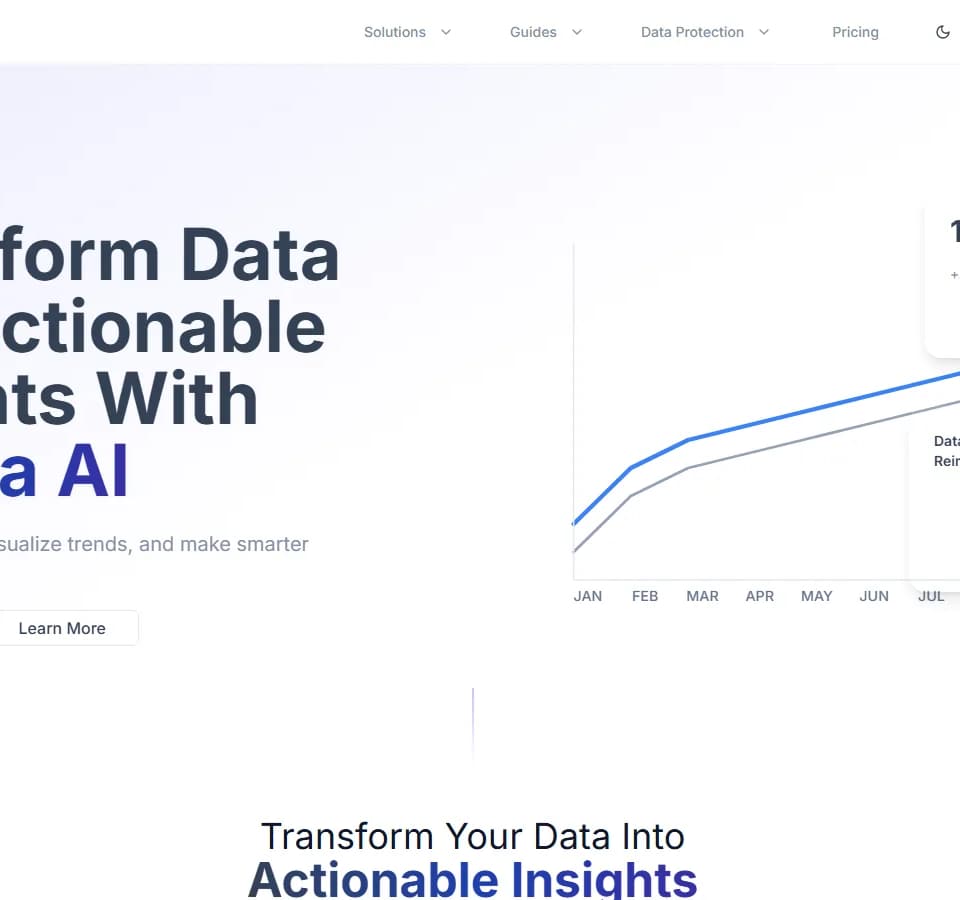
- Automatically generated visualizations such as bar charts, heatmaps, dashboards, scatter plots, pie charts, and forecast charts.
- AI-generated reports that combine charts and insights in formatted PDF documents, with branding options described by the vendor.
- Data support for CSV, Excel, JSON, PostgreSQL, and database sources.
- Export and sharing options including image exports, PDF downloads, and embeddable visualizations.
Who it helps
Alemia is aimed at business users, analysts, and teams that need to investigate sales, customer, or operational data without relying entirely on manual calculations or specialist coding skills. It may also suit teams that need to turn analysis into polished reports for internal review or decision-making.
How it fits a workflow
A typical workflow starts by uploading a file or connecting a database. The user then asks a question such as which regions have the highest sales. Alemia processes the data, generates a response and visualization, and can turn the resulting analysis into a report or shareable asset. This makes it relevant for exploratory analysis, recurring reporting, and quick presentation of trends.
Strengths and limits
Alemia’s main strengths are its plain-English interface, broad support for common structured-data formats, automated chart generation, and built-in PDF reporting. These features can make an analytics workflow more accessible to non-technical users.
The website describes supported formats, outputs, and security measures, but does not provide detailed evidence about analytical accuracy, forecasting methodology, usage limits, or the full scope of database and integration support. Teams evaluating it for important decisions should validate its results against known calculations and review the applicable security and service terms before connecting sensitive data.