
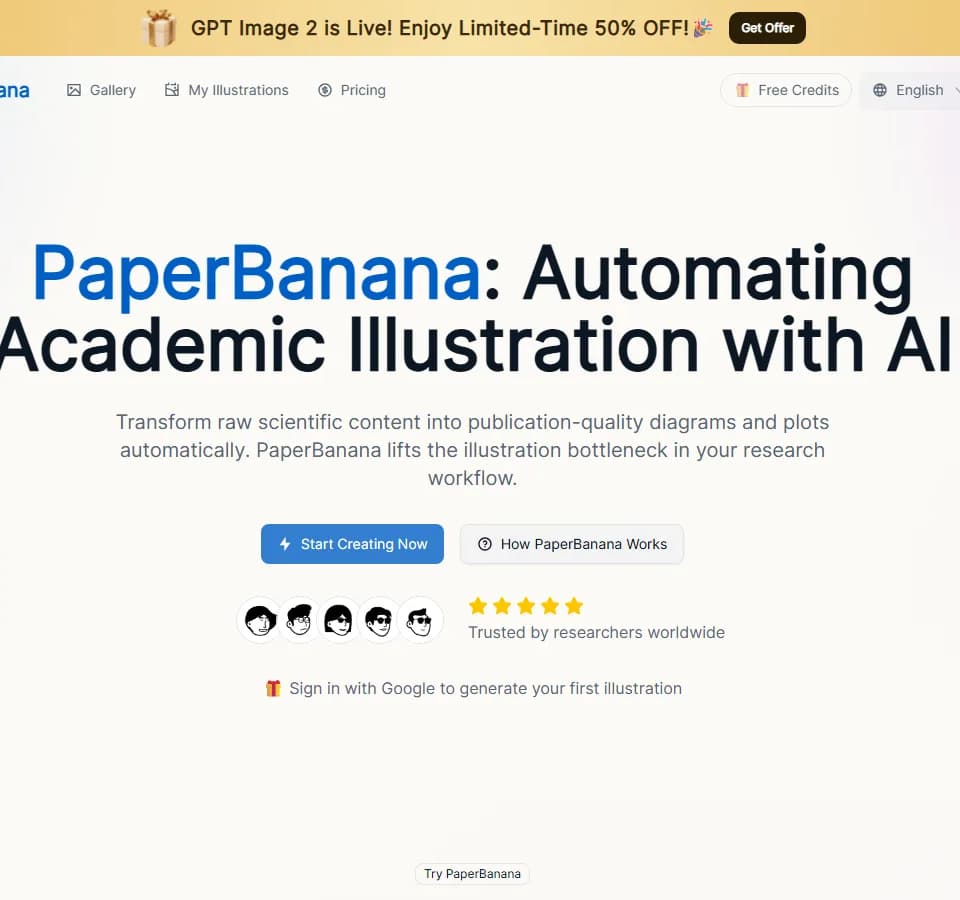
Paper-Banana.ai
Paper-Banana.ai provides an academic illustration workflow for researchers preparing figures and presentations. The PaperBanana site accepts methodology descriptions, data or scientific concepts and generates visual drafts. Its examples include neural-network architectures, system pipelines, statistical plots and educational infographics.
Describing the figure
You start with a text description of the research content and the illustration you want. The FAQ also allows reference images for style guidance. The page offers example prompts for transformer architectures, GAN training pipelines, retrieval-augmented generation and multi-agent systems, which can help identify the type of diagram you need.
The publisher describes five agent roles: Retriever, Planner, Stylist, Visualizer and Critic. They find reference examples, plan the figure, choose its presentation, render it and inspect it for refinement. This is the service's described generation process, rather than a guarantee that every scientific relationship will be represented correctly.
Diagrams, plots and revision
For methodology diagrams, the workflow focuses on labeled components and their connections. Statistical plots have a code-based option: the service generates executable Python Matplotlib code that users can download and modify. Inspect that code and compare plotted values, scales and labels with your dataset before submitting a figure.
Aesthetic enhancement targets rough sketches, while refinement adjusts colors, fonts and layout in existing diagrams. If an initial generation misses the intended structure, you can revise the prompt and generate again. Educational infographics provide a separate use for explaining technical concepts in lectures, handouts or training materials.
Downloads and credits
The site offers Google sign-in for a first illustration and advertises free starting credits. Its pricing page lists Starter, Popular and Pro packages, with different credit allowances, queue priorities and support levels. The displayed packages include annual totals and credits valid for one year. Confirm the selected billing option and the generation charge before purchasing, since the generator and pricing table use different credit examples.
The FAQ permits generated illustrations in research papers, presentations, posters and other academic materials. It describes high-resolution image output and downloadable Python code for statistical plots, but does not name specific image-file formats. Match the downloaded file to your venue's requirements, and review the scientific content even when the service labels the result publication-ready.