


AISummarizer.ai
AISummarizer.ai condenses pasted text and uploaded documents, with copy or text-download output and a displayed per-summary credit charge.
World Monitor brings news, maritime traffic, aviation, markets and country-risk signals onto a map, with source-attributed briefs and documented integration limits.
World Monitor is a global situational-awareness dashboard that combines news and market data with maritime, aviation and infrastructure signals. Its homepage offers a free dashboard entry point and routes for checking breaking events, maritime chokepoints and country-risk changes.
The documentation describes a 3D globe or flat map with toggleable layers, an AI-generated daily intelligence brief and panels for markets and other signals. It also lists Route Explorer for examining supply-chain exposure and a Scenario Engine for visualizing disruption scenarios.
A useful starting question is whether a reported disruption has a plausible connection to the route or country you are following. Open the cited source and check its observation date before combining it with a headline. A map marker and an AI summary can help organize evidence, but their presence does not prove an event's cause or predict its outcome.
Country-level measures also differ. The documentation distinguishes a high-frequency Country Instability Index from the broader Country Resilience Index. Compare the method and refresh date before treating a change in one as equivalent to a change in the other.
World Monitor documents REST services and an MCP connection for compatible agents. The API reference warns that MCP coverage is narrower than the REST catalog. An endpoint's appearance in OpenAPI does not mean an MCP tool exposes it.
Batch requests can combine up to twenty documented GET operations, but each operation still counts against rate limits. Select only the fields and services needed for a task, and keep unavailable data distinct from a measured zero. The API reference explicitly says an empty conflict result does not establish that no conflict occurred; available snapshots and filters constrain what a response can show.
The introductory documentation identifies the project license as AGPL-3.0-only. Commercial use under that license requires complying with its copyleft and source-availability terms, while separate commercial licensing offers another route for private-source arrangements.
The homepage marks some newer features PRO, so free dashboard access should not imply access to every analysis or integration. Confirm the feature, credentials and data source required for your workflow. Use risk scores and generated briefs as inputs to further investigation rather than as sole grounds for financial or safety-critical decisions.
Before you try it
Its docs describe a structured, source-attributed summary of the day's headlines. It can be viewed in the dashboard, shared by link or presented as a social image carousel. Follow the cited sources before relying on an important event claim or a generated interpretation.
Official sourceNo. The docs distinguish a high-frequency Country Instability Index from a broader Country Resilience Index. They also distinguish six-hour live API refreshes from monthly crawlable country snapshots. Check the indicator, coverage and timestamp rather than compare differently timed scores as one live measure.
Official sourceThe documentation describes a Model Context Protocol server with curated tools and authentication through OAuth 2.1 or a direct API key. It also lists web, desktop and terminal surfaces. Check the chosen integration's access and data-source limits instead of assuming a public map view exposes every raw feed.
Official sourceAISummarizer.ai condenses pasted text and uploaded documents, with copy or text-download output and a displayed per-summary credit charge.

Google Workspace combines business email and collaborative documents with plan-dependent Gemini features, storage and administrative controls.
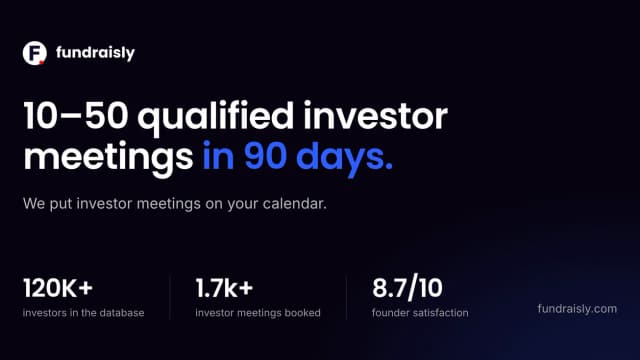
Fundraising support for startup founders combining investor matching, warm-introduction discovery, targeted outreach, and guidance on fundraising materials and strategy.
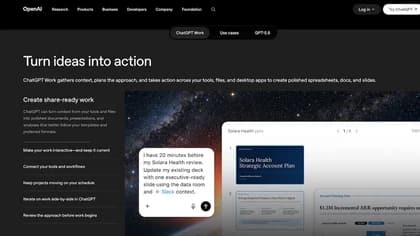
ChatGPT Work is a team-focused ChatGPT workspace for creating business deliverables, collaborating on shared context, connecting tools, and automating recurring tasks.
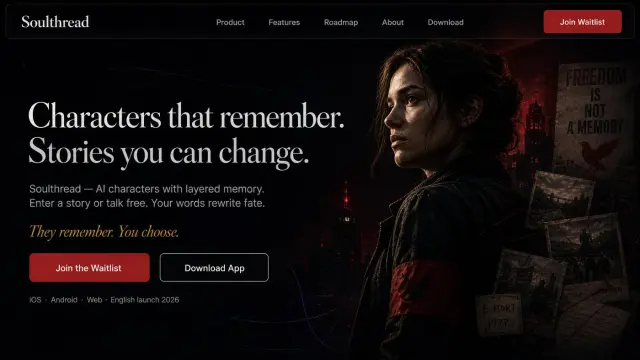
Soulthread combines story-based AI character interactions with free-form chat. Its published monthly plans separate chat access from full story chapters.

CitedEvidence combines scholarly discovery, PDF questions and academic writing modules, with source records and API or MCP access for builders.